> ## Documentation Index
> Fetch the complete documentation index at: https://docs.autosana.ai/llms.txt
> Use this file to discover all available pages before exploring further.
# Performance Monitoring
> Track memory, CPU, and rendering metrics during test runs
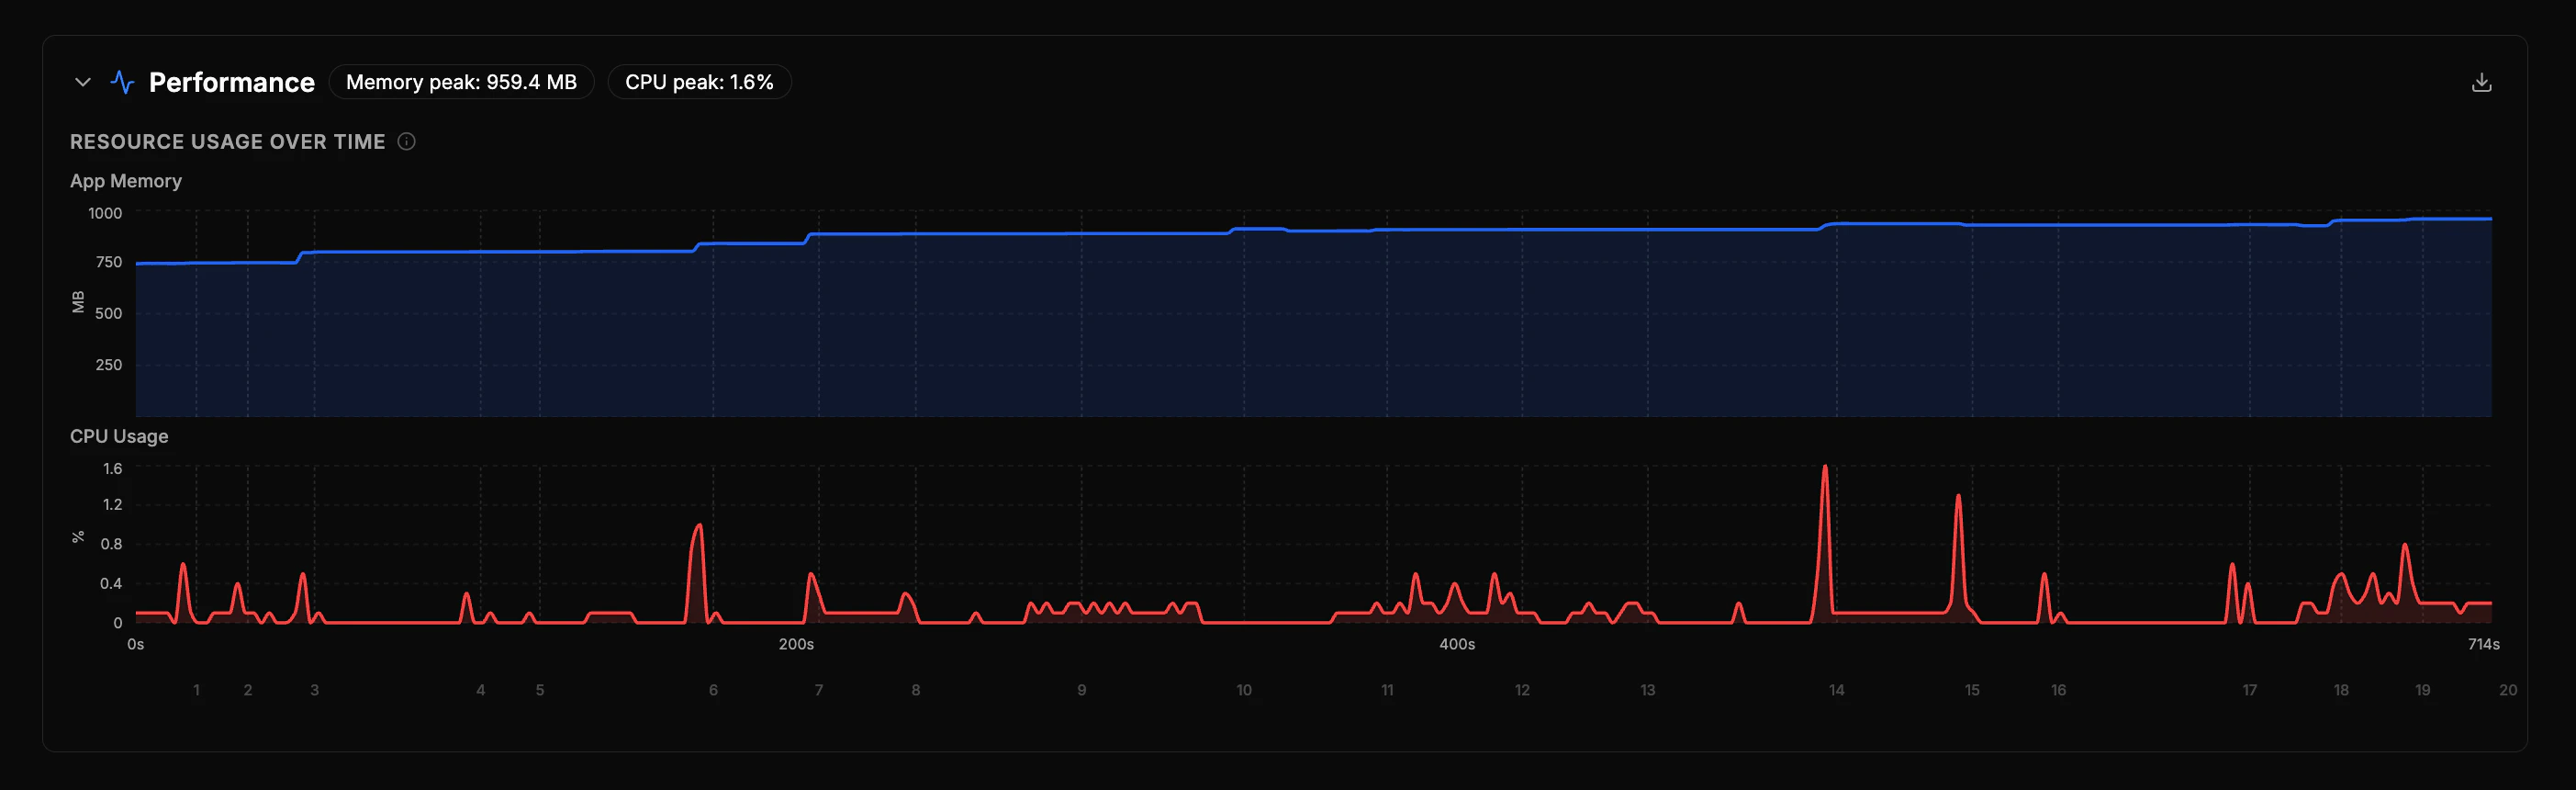
Autosana automatically collects performance metrics during test runs across all platforms. After a run completes, a **Performance** section appears on the run detail page with charts and diagnostics.
 ## What's Collected
| Metric | Description |
| ------------------- | -------------------------------------------------------------------- |
| **Memory** | App memory usage, sampled every \~2 seconds |
| **CPU** | App CPU usage over time |
| **Frame rendering** | Total frames, slow frames, stutter rate, and render time percentiles |
| **Device RAM** | Total device RAM for context (e.g., "350 / 2048 MB") |
| Metric | Description |
| ---------- | ------------------------------------------- |
| **Memory** | App memory usage, sampled every \~2 seconds |
| **CPU** | App CPU usage over time |
iOS metrics are measured from the simulator. Absolute values differ from a real device — use them for **comparing across builds** and detecting regressions.
iOS performance monitoring is currently **not available for local CLI runs**. It works for cloud-hosted runs.
| Metric | Description |
| ------------------- | --------------------------------------------------------- |
| **Memory** | JS heap usage over time |
| **CPU** | Browser CPU usage over time |
| **Core Web Vitals** | Largest Contentful Paint, Layout Shift, Interaction Delay |
| **Page timing** | Server Response, Page Ready, Fully Loaded |
| **Runtime health** | Blocking tasks, total blocked time, page complexity |
Web Vitals thresholds follow [Google's recommendations](https://web.dev/articles/vitals):
* **Good** (green): LCP ≤ 2.5s, CLS ≤ 0.1, INP ≤ 200ms
* **Needs work** (amber): LCP ≤ 4s, CLS ≤ 0.25, INP ≤ 500ms
* **Poor** (red): above those thresholds
## What's Collected
| Metric | Description |
| ------------------- | -------------------------------------------------------------------- |
| **Memory** | App memory usage, sampled every \~2 seconds |
| **CPU** | App CPU usage over time |
| **Frame rendering** | Total frames, slow frames, stutter rate, and render time percentiles |
| **Device RAM** | Total device RAM for context (e.g., "350 / 2048 MB") |
| Metric | Description |
| ---------- | ------------------------------------------- |
| **Memory** | App memory usage, sampled every \~2 seconds |
| **CPU** | App CPU usage over time |
iOS metrics are measured from the simulator. Absolute values differ from a real device — use them for **comparing across builds** and detecting regressions.
iOS performance monitoring is currently **not available for local CLI runs**. It works for cloud-hosted runs.
| Metric | Description |
| ------------------- | --------------------------------------------------------- |
| **Memory** | JS heap usage over time |
| **CPU** | Browser CPU usage over time |
| **Core Web Vitals** | Largest Contentful Paint, Layout Shift, Interaction Delay |
| **Page timing** | Server Response, Page Ready, Fully Loaded |
| **Runtime health** | Blocking tasks, total blocked time, page complexity |
Web Vitals thresholds follow [Google's recommendations](https://web.dev/articles/vitals):
* **Good** (green): LCP ≤ 2.5s, CLS ≤ 0.1, INP ≤ 200ms
* **Needs work** (amber): LCP ≤ 4s, CLS ≤ 0.25, INP ≤ 500ms
* **Poor** (red): above those thresholds