What’s Collected
- Android
- iOS
- Web
| Metric | Description |
|---|---|
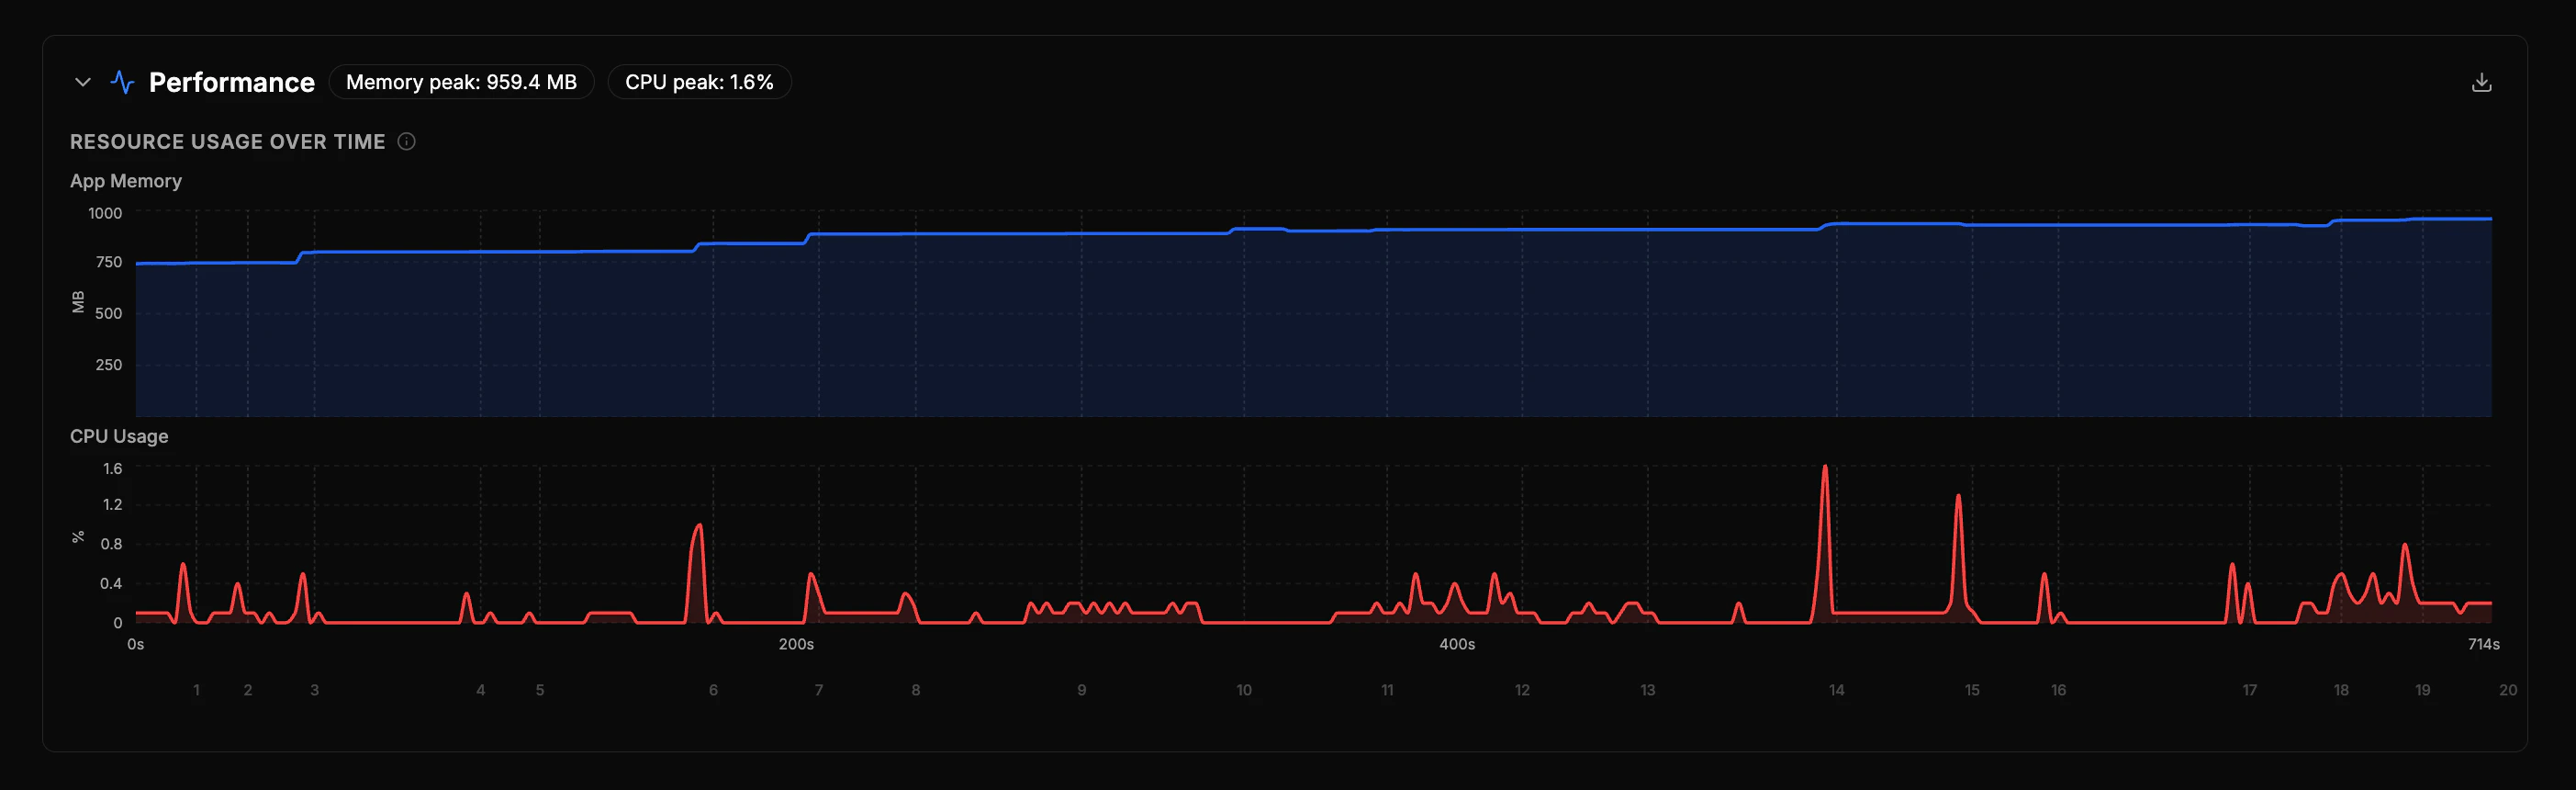
| Memory | App memory usage, sampled every ~2 seconds |
| CPU | App CPU usage over time |
| Frame rendering | Total frames, slow frames, stutter rate, and render time percentiles |
| Device RAM | Total device RAM for context (e.g., “350 / 2048 MB”) |